Fewer loose numbers, more answers
The dashboard shows your church today, and reports answer what every pastor really wants to know: are the people who come staying and getting connected?
Dashboard in the free plan · reports in the full app, free for 30 days
Lots of data, few answers
Spreadsheets nobody adds up
The data is there, but pulling it together for the leaders' meeting takes a weekend.
Counting isn't understanding
You know how many came on Sunday, but not whether newcomers are staying.
Deciding blind
Where should you focus this year? Without trends, it's hard to know.
Your church's health, at a glance
-
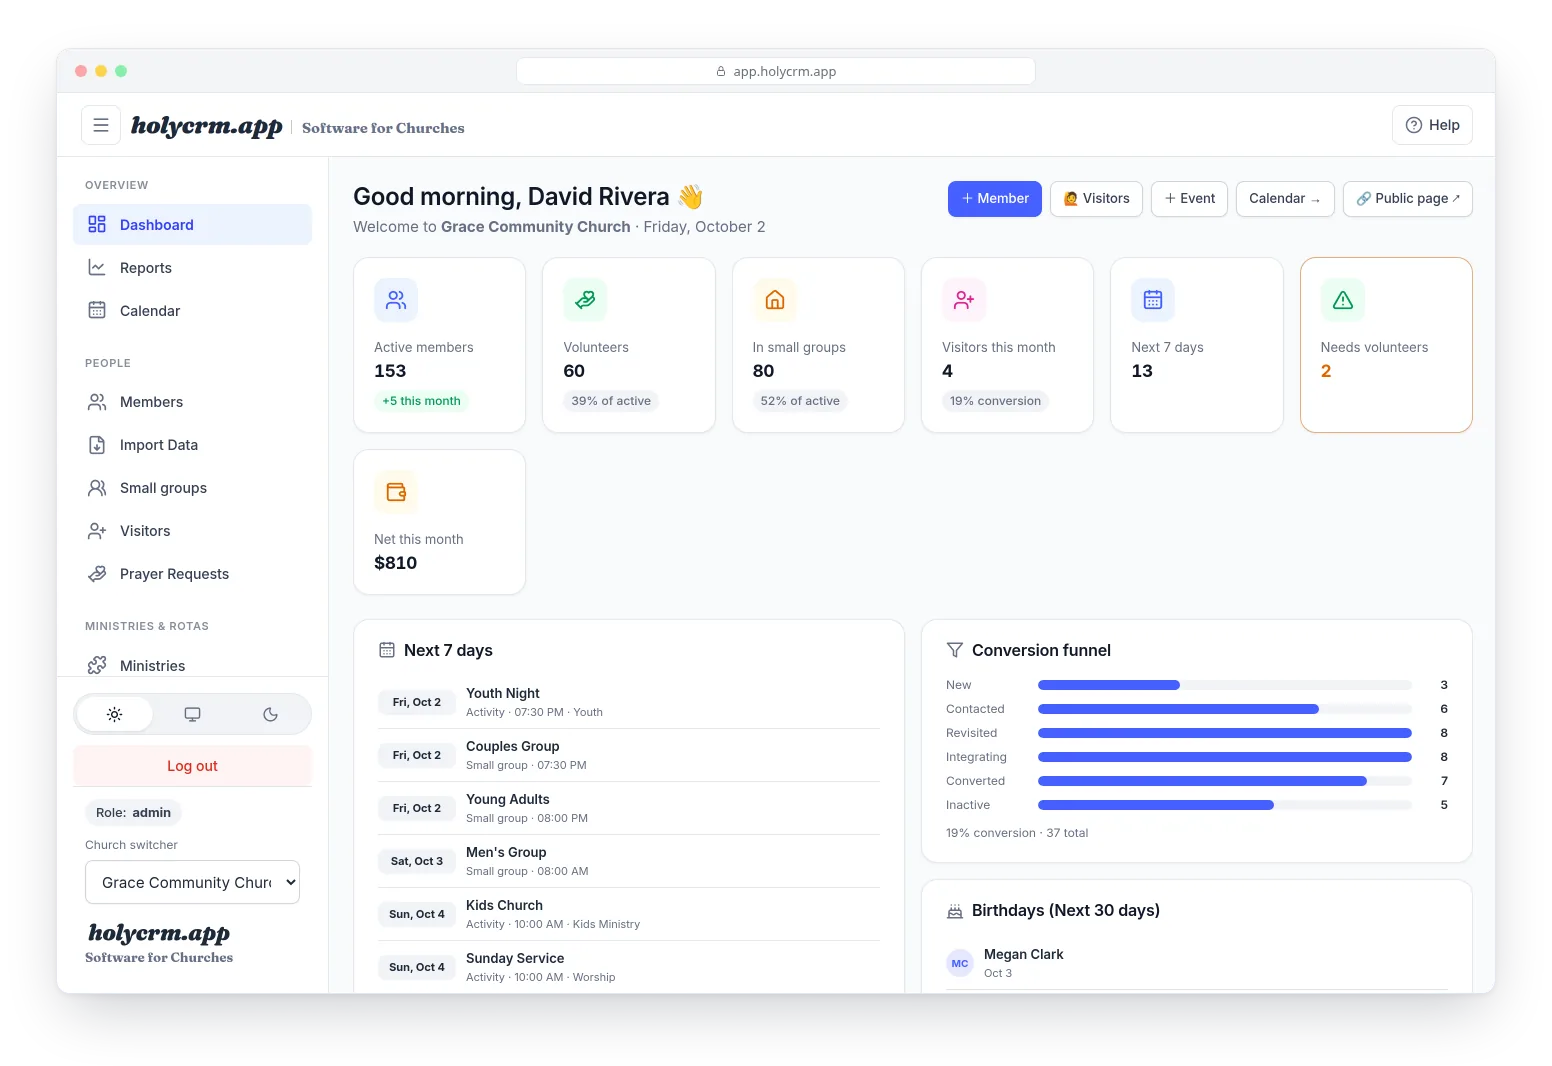
1The dashboard
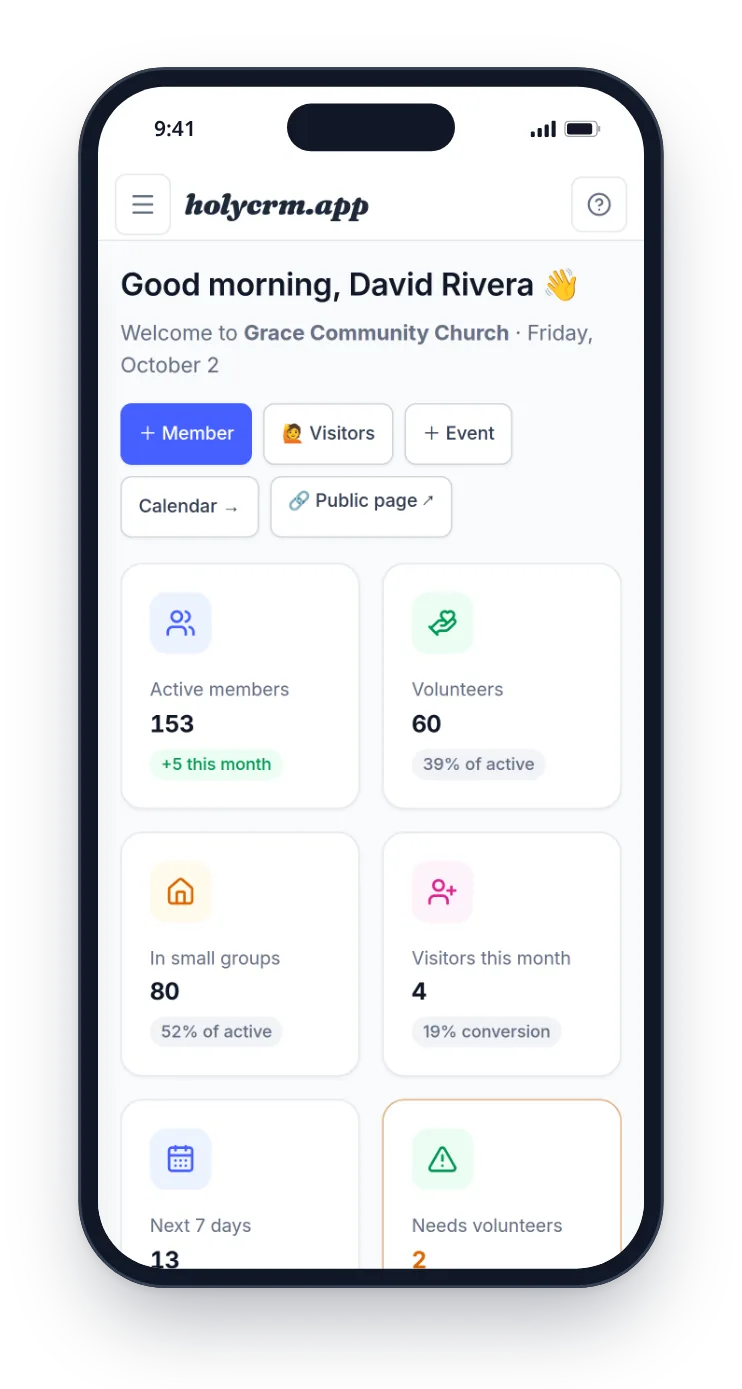
Today's picture, on your phone too
Active members, volunteers, people in small groups, guests this month, the next 7 days, rotas still to fill and this month's net giving.
- Birthdays in the next 30 days
- Each person sees only what their role allows
Five questions, answered every month
First-time guests, how many were followed up, how many now attend regularly, volunteers serving three or more times, and guest-to-member conversion.
- Compared with last month
- Worked out from what your team already records
Attendance, groups and giving over time
Pick 6, 12 or 24 months and see average attendance per meeting, which small groups are growing and net giving month by month.
- Compared with the previous period
- Amounts converted to your church's currency
Data in service of pastoral care
Guests who stay
Know how many first-time guests now attend regularly.
Real follow-up
See what share of this month's guests got a call or a message.
Conversion
What share of guests became members, with fair time to decide.
Tired volunteers
Spot the people serving three or more times a month before they burn out.
Growing groups
Small groups with real attendance growth, compared with their own history.
Giving over time
Net giving month by month, compared with the previous period.
Questions about reports
Who can see reports?
Administrators and coordinators, because they include giving figures. The dashboard adapts to each role: everyone sees only the cards for what they're allowed to view.
Do I have to enter anything extra?
No. Reports are worked out from what your team already records: guests, follow-ups, attendance, rotas and giving. If you haven't used a feature yet, that card fills in over time.
How much history do they show?
Trends show 6, 12 or 24 months, always compared with the same period before.
Can I export or print them?
There's no report export yet. What you can do is download all your church's data as a spreadsheet from Data & privacy.
Is it included in the free plan?
The dashboard is included in the free plan. Reports are part of the full app: US$30 a month or US$300 a year per church, which you can try free for 30 days, no card.
Want the step-by-step? Read the reports guide in the Help Center
More from HolyCRM
Know your church beyond Sunday
Try it free: the numbers fill in as your team uses the app.